
You've successfully copied this link.
Juwai releases Global Property Index Report Q3 2016

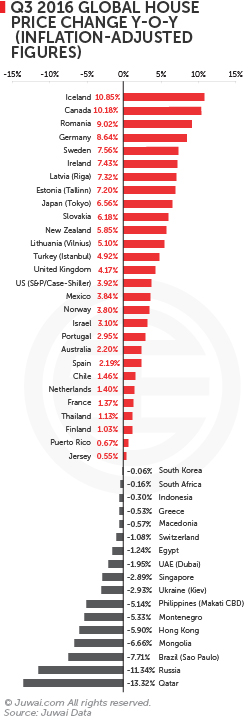
Q3 2016 saw housing prices rise y-o-y in 28 out of 45 housing markets that published housing statistics.
 We analyse our latest Juwai Global Property Index (GPI) Report, which is specially tailored to equip Chinese property buyers with research for their property investment hunt abroad, and share the strongest-performing housing markets in the third quarter of last year.
We start off with the best-performing housing markets first. Europe continues to dominate, with seven out of the top 10 housing markets in Q3 2016 being in Europe, and 17 out of its 23 European housing markets saw an increase in housing prices.
The top 5 leading markets in Q3 2016 were Iceland (+10.85%), Canada (+10.18%), Romania (+9.02%), Germany (+8.64%), and Sweden (+7.56%).
In North America, while a continued surge in housing prices has led Canada to become the second-best performing market, the US housing market saw a stark contrast, as growth gradually slow in its housing market, despite the projection of a robust US economy.
Over at the Pacific Ocean, a series of restrictions and tightened policies on taxes and residential loans have begun to reveal results. Housing markets in both Australia and New Zealand – the top performer in the previous quarter – have begun to cool, and while housing prices continued to rise y-o-y, the increase was much lower than the same period last year.
Here in Asia, housing prices in six out of eight Asian markets fell y-o-y, with only Japan and Mongolia being the two markets that displayed better performances compared to the same period a year ago.
Elsewhere, the downtrend continues, as housing markets in the Middle East, Latin America, and Africa saw either falling housing prices fell or sharply weakened gains.
Regional snapshots:
North American markets polarise
- US real estate market growth slows, despite strengthened demand and good economic outlook – the S&P/Case-Shiller seasonally adjusted national home pricing merely grew 3.92% y-o-y, which was lower than the 4.82% charted the same period last year.
- Canadian market defies cooling measures to accelerate – undeterred by strict policy restrictions, housing prices in 11 major cities increased 10.18% y-o-y, more than double from the 4.57% charted in Q3 2015, and becoming the largest annual increase seen in the Canadian housing market since Q2 2010 as well.
Pacific Ocean/Oceania markets cool significantly
- New Zealand housing market slows – tightened policies on residential loans saw nationwide median housing prices growing merely 5.85% y-o-y, a far cry from the 14.86% increase charted the same period in Q3 2015, as well as the 10.43% growth in the previous quarter.
- Australian market downtrend prevails – as cooling measures begin to take effect, combined housing prices in eight major cities merely rose 2.2%, which is its lowest increase since Q2 2013.
Most European markets continue heating up
- Iceland market charts an outstanding performance – a combination of rapid economic development, high demand for property, and limited housing supply (especially in Reykjavik) propelled a y-o-y hike of 10.85% in Iceland.
- Romanian housing market rally continues – housing prices hit 9.02%, thanks to its surprisingly robust economic growth, its strong construction market, and its government that is staunchly committed to rebuilding credibility in Romania.
- Germany housing prices climb 8.64% y-o-y – higher demand and housing supply shortages, bolstered by ultra-low interest rate policy and strong economic fundamentals, led to a steady rise of housing prices in Germany.
- Swedish market growth on the rise – a new installment policy in June 2016 saw housing prices continue charting gains in Sweden, albeit at a more sustainable pace. Swedish housing prices grew 7.56%, a healthy increase yet considerably subdued in comparison with the previous y-o-y growth of 8% (Q2 2016), 9.7% (Q1 2016), 12.5% (Q4 2015), 11.09% (Q3 2015), 10.68% (Q2 2015), and 9.14% (Q1 2015).
- Irish housing prices continue to grow – property prices grew 7.43% y-o-y in Ireland, predominantly driven by its projected healthy economic growth rate of 4.9% in 2016, as well as an additional 3.6% increase expected for 2017.
- Latvia housing market improves significantly – buoyed by IMF projections of a 2.5% GDP growth rate, average apartment prices in Riga rose 7.32% y-o-y and 3.82% q-o-q.
- Estonia’s housing market booms – apartment prices in Tallinn climbed 7.2% y-o-y, compared to 2.75% and 1.14% charted in Q2 2016 and Q1 2016, respectively.
- Other European countries with strong performances – Slovakia (+6.18%), Lithuania (+5.1%), Turkey (+5.1%), the UK (+4.17%), and Norway (+3.8%).
- Other European countries with modest gains – Portugal (+2.95%), Spain (+2.19%), the Netherlands (+1.4%), and France (+1.37%).
European markets that remain weak or in decline
- Russia remains the weakest market in Europe – a prudent monetary policy has stabilised Russia’s inflation situation, however, its economic crisis and currency depreciation continue to plague its housing market. Housing prices still fell -11.34% y-o-y in Q3 2016, although considered slightly better than the -13.38% decline during the same period last year.
- Montenegro market shows tepid growth – while the IMF expects Montenegro’s economy to grow 5.1% in 2016, housing prices for new residences still dropped -5.33% y-o-y, although it is still a significant improvement from the -10.15% recorded in Q2 2016.
- Other European countries with weak housing prices – Ukraine (-2.93%), Switzerland (-1.08%), Macedonia (-0.57%), and Greece (-0.53%).
Most Asian markets continue to wane, except Japan
- Japan housing market continues ascending – rising market demand, appreciation of the Japanese Yen, and a better-than-expected economic performance led to a housing price hike of 6.56% y-o-y, compared to 5.7% and 5.4% in Q2 2016 and Q1 2016, respectively.
- Mongolia market displays distinct progress – although Mongolia’s price decline of -6.6% in Q3 2016 is one of the five markets charting the biggest negative performance, it’s still a marked improvement from its past performances of -10.5% (Q2 2016), -11.93% (Q1 2016), -12.24% (Q4 2015), -14.5% (Q3 2015), -15.28% (Q2 2015), and -14.28% (Q1 2015).
- Hong Kong market slump continues – an economic slowdown saw housing prices slide -5.9% y-o-y in Hong Kong this quarter, a sharp contrast from the 12.66% y-o-y rise the year before. However, Q3 2016 still charted a surprising 6.08% q-o-q increase.
- Philippine housing prices dip – average housing prices of 3-bedroom apartments in the Makati CBD slid -5.14% y-o-y, a big difference from the y-o-y gain of 5.41% of the same period a year before.
- Singapore market stays weak – Singapore’s economic downturn led to a -2.89% y-o-y decline amidst dwindling supply and demand.
- Indonesia housing prices remain feeble – housing prices continued its seventh consecutive quarterly decline to fall -0.3% y-o-y, even as housing demand continues to surge while overall housing supply growth rate is projected to slowdown gradually in the next few years.
- South Korea’s housing market flags – while its economy is expected to grow by 2.7%, its national housing purchase price index still marked a -0.06% y-o-y and -0.42% q-o-q decline in Q3 2016.
Middle East markets still in the doldrums
- Qatar bottoms to become worst-performing market – an economic recession saw its national property price index slump -13.32% y-o-y, a dramatic contrast from the 16.3% growth in Q3 2015.
- Dubai remains the most volatile market – property prices continued to slump for its seventh consecutive quarter to drop -1.95% y-o-y. However, such performance is a significant improvement from the -14.1% decline chartered in Q3 2105, and Q3 2016 saw a surprising 0.13% q-o-q increase.
- Egypt market shows improved performance – Egypt’s real estate index merely fell -1.24%, a staggering contrast compared to the previous records of -11.2% (Q2 2016), -9.49% (Q1 2016), -14.22% (Q4 2015), and -12.48% (Q3 2015). Furthermore, Q3 2016 marked a substantial q-o-q gain of 11.61%, which could be partially attributed to recent measures taken by the Egyptian government to stimulate the market, such as the recently enacted Law 17/2015, which now allows foreigners to own land and property in Egypt.
- Israeli housing market cools – housing prices in Israel has tapered in tandem with its economic slowdown, as well as weakening housing supply and demand. Average housing prices merely rose 3.1%, its lowest y-o-y growth since Q1 2014.
Other housing markets of note
- Brazilian market decline lingers – bogged down by a precarious political situation along with its incessant economic crisis, property prices in Sao Paulo fell -7.71% y-o-y and -1.23% q-o-q, which is worse than the -5.54% decline in Q3 2015.
- South African property market still stagnant – an uncertain economy plus a weak Rand saw medium-sized apartment price index fall for its fourth quarter in a row, dipping -0.16% y-o-y.
Conclusion:
Most of the global housing markets remain positive on an overall note. Although housing markets in most parts of the world showed signs of a slowdown, housing markets in most of Europe and Canada remained strong during Q3 2016.
More importantly, this report serves to highlight which property markets that could rise to become potential investment destinations for Chinese property buyers, who are not only becoming more and more open to alternative markets, but are also increasingly on the lookout for better yields and return on investments – something that could be found in many of the above markets that currently show falling property prices.
So take note of these global trends, agents, as this could be an opportunity for you to leverage in your campaign to attract property investors from China.
Download the full GPI Report in Chinese here.
NOTE: This report uses all inflation-adjusted data, which is the year ending in the third quarter of 2016. In this report, the inflation adjustment method is to change the nominal house price of each country by the same period of the consumer price index to eliminate the impact of inflation on house prices. Inflation-adjusted data more truly reflect changes in house prices.
Liked this article? Sign up for free to get Juwai Juwai Asia Market updates!
Resources
Contact Us
- Shanghai: +86 (021) 33629868
- Hong Kong: +852 5804 4670

Our Property Marketplaces
Juwai.com >
Global property portal available in Chinese
Juwai.asia >
Asia wide portal for global real estate
Juwai News
Subscribe to receive the latest news on Asian buyers, the Asia market, and Juwai.
2025 © Juwai. All Rights Reserved Privacy Policy | Terms of Service